

Download The Course Brochure Link
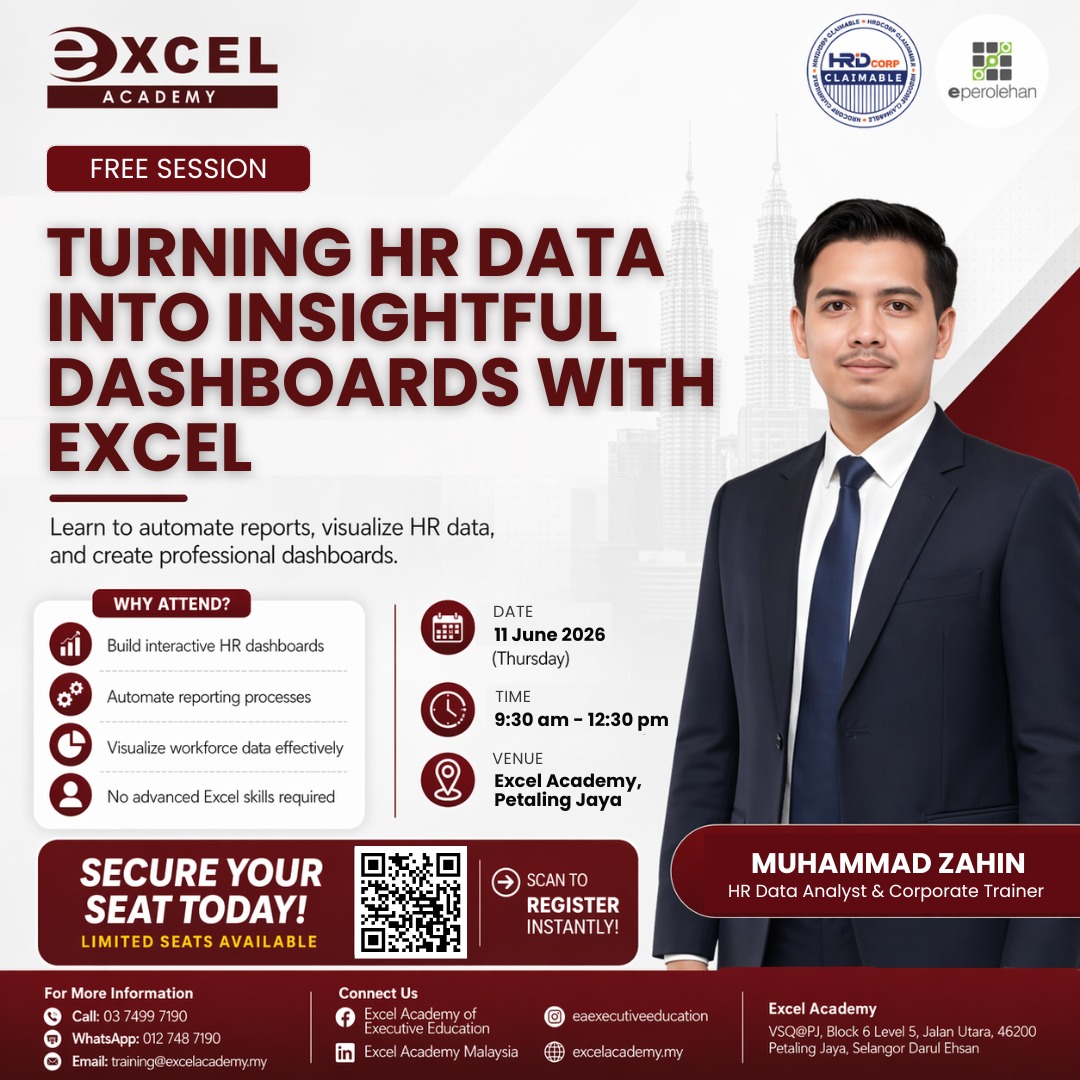
This half-day interactive session equips HR professionals with the practical skills to transform raw HR data into automated reports and interactive dashboards using Microsoft Excel. Whether you are spending too much time manually compiling HR figures or struggling to present workforce data in a clear and compelling way for leadership, this session gives you the hands-on tools and techniques to work smarter. Through live demonstrations, guided practice and real HR dataset exercises, participants will experience firsthand how Excel can streamline data cleaning, automate reporting and bring HR metrics to life through professional, interactive dashboards. By the end of the session, participants will walk away with the confidence and capability to turn messy spreadsheets into meaningful HR insights, making data-driven decisions faster and more effectively.
What Will You Learn in Turning HR Data Into Insightful Dashboards with Excel?
- Clean and structure HR data accurately to eliminate duplicates, inconsistencies and missing values, ensuring a reliable foundation for analysis.
- Automate HR reports using Excel formulas and PivotTables, reducing manual effort and enabling reports to refresh dynamically.
- Visualise key HR metrics with meaningful charts and conditional formatting to communicate workforce trends clearly and professionally.
- Build a complete, professional interactive HR dashboard with slicers, timelines and linked summary tables for executive-level reporting.
Course Outline
Module 1: Foundation, Understanding HR Data
- Types of HR data: headcount, attendance, turnover, performance
- Common HR data problems: duplicates, inconsistencies, missing values
- Best practices for structuring data in Excel
Module 2: Data Cleaning and Preparation
- Removing duplicates, Text to Columns, Flash Fill
- Standardising data with TRIM, PROPER, IF, IFERROR
- Converting raw data into structured Excel Tables
Module 3: Automating HR Reports
- COUNTIFS, SUMIFS, AVERAGEIFS
- PivotTables for HR metrics
- Refreshing reports automatically
Module 4: Visualising HR Data
- Choosing the right chart for HR metrics
- Headcount trend and turnover charts
- Conditional formatting for insights
Module 5: Building the HR Dashboard
- Dashboard layout principles
- Slicers and Timeline interactivity
- Linking charts and summary tables
- Hands-on dashboard activity
Wrap-Up and Q&A
- Key takeaways recap
- Common mistakes to avoid
- Open Q&A session