

Download The Course Brochure Link
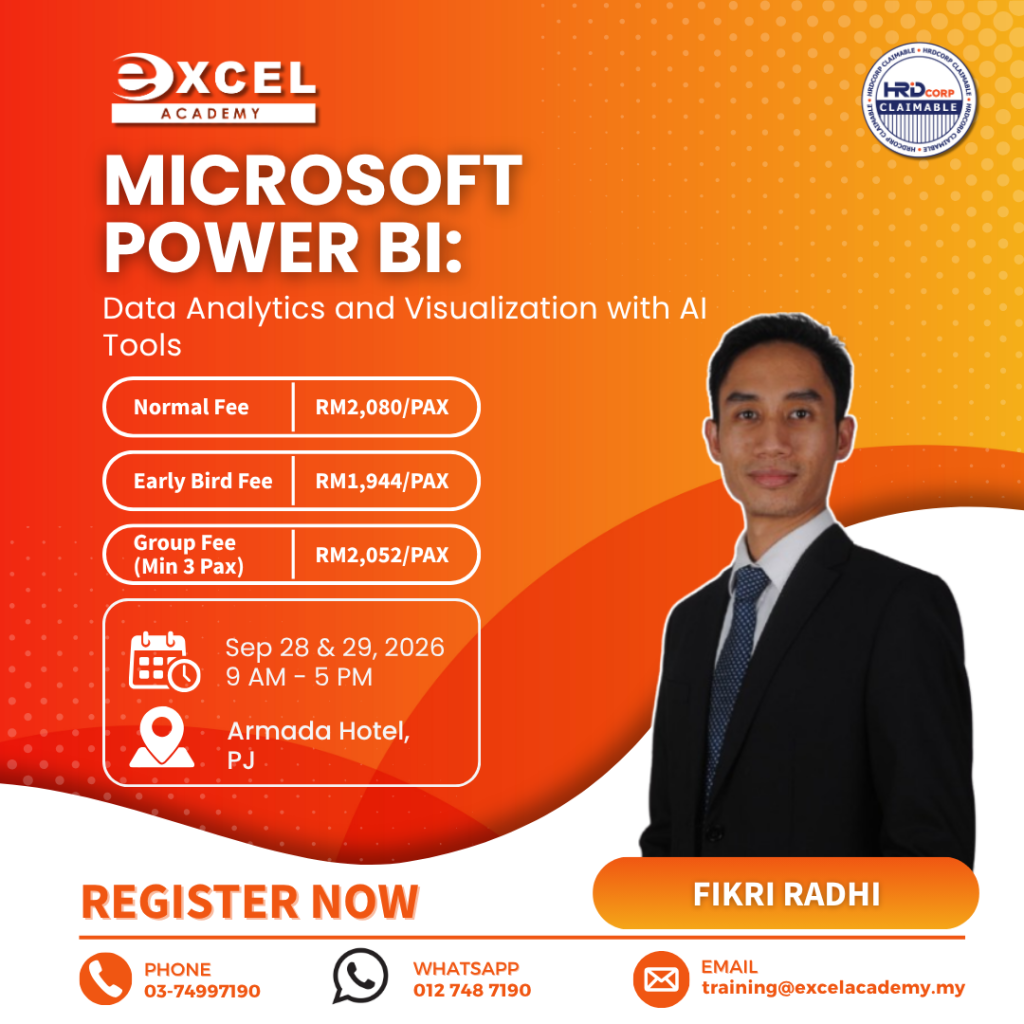
Microsoft Power BI with AI Tools is a practical training programme designed to help professionals transform raw data into meaningful insights, interactive dashboards and visual reports using Microsoft Power BI and AI-assisted capabilities.
Participants will develop practical skills in data preparation, modelling, analysis and visualisation while exploring how AI can support reporting, identify patterns and simplify selected analytical tasks. The programme covers Power Query, data modelling, DAX, interactive dashboards, AI-assisted insights and report publishing.
Through hands-on exercises, participants will learn how to turn business data into clear, actionable information that can support better decision-making. By the end of this Microsoft Power BI with AI Tools programme, participants will have greater confidence in building reports and dashboards that communicate data effectively.
What will you learn in this Microsoft Power BI with AI Tools: Data Analysis and Visual Reporting
- Understand the fundamentals of Business Intelligence (BI) and how AI tools elevate data
analysis and reporting. - Navigate the Power BI interface and integrate AI capabilities seamlessly into data workflows.
- Utilize natural language processing (NLP) tools like Q&A for instant data queries and smarter
reporting. - Prepare and transform raw data using Power Query Editor, optimizing it with AI enhancements.
- Design and customize visually compelling reports and dashboards with AI-generated
narratives and predictive analytics. - Publish and share reports and dashboards securely, ensuring collaborative engagement and
adherence to best practices.
Why Attend This Microsoft Power BI with AI Tools Training?
This Microsoft Power BI with AI Tools training is designed for professionals who want to improve the way they analyse, visualise and communicate business data.
Instead of relying only on static spreadsheets or manually prepared reports, participants will learn how Power BI can bring together data from different sources and turn it into interactive reports and dashboards. The programme introduces practical techniques for preparing data, creating relationships, performing calculations and presenting findings in a clearer visual format.
AI-assisted capabilities are introduced alongside the core Power BI workflow to help participants explore data more efficiently, identify useful patterns and communicate findings more effectively. By completing the Microsoft Power BI with AI Tools programme, participants can develop a more structured approach to analysing business data, creating interactive dashboards and presenting insights that support better workplace decisions.
Course Outline
Module 1: Introduction to Self-Service BI and AI Tools
– Overview of Business Intelligence (BI) Concepts
– Introduction to AI Tools in BI: Transforming Data Analysis
– Understanding Microsoft Power BI’s AI Capabilities
Module 2: Getting Started With Power BI
– Navigating the Power BI Interface and Features
– Understanding the Differences Between Power BI Desktop and Power BI Service
– Setting Up Power BI for Data and AI Integration
Module 3: Power BI Data Sources and Preparation
– Importing Data from Various Sources
– Exploring Data Quality Enhancements
– Utilizing AI to Power Query Editor for Data Cleaning and Transformation
Module 4: Fundamentals of Data Modeling
– Creating and Managing Relationships in Data Models
– Utilizing AI to Optimize Data Types and Structures
– Simplifying Data Models with Automated Insight
Module 5: Advanced Data Analysis With DAX And AI
– Introduction to DAX (Data Analysis Expressions)
– Using Calculations and Measures for Advanced Data Analysis
– Applying AI-powered to create a DAX Formula
Module 6: Creating Advanced Dashboards With AI-Driven Insights
– Designing Interactive Dashboards Using Slicers and Filters
– Incorporating AI-Generated Predictive Analytics and Trends
– Best Practices for Building AI-Enhanced Dashboards
Module 7: Leveraging AI Models In Power BI
– Applying Sentiment Analysis and Text Mining in Power BI
– Creating Custom AI Models for Industry-Specific Use Cases
Module 8: Enhancing Report Design With AI
– Using AI to Automate Report Narratives and Explanations
– Optimizing Reports for Performance and Accessibility
– Applying AI-Enhanced Data Storytelling Techniques
Module 9: Publishing, Sharing, and Collaborating With AI Insights
– Publishing Reports to Power BI Service
– Collaborative Features: Sharing AI-Powered Dashboards
– Ensuring Security and Compliance in Reporting
The Microsoft Power BI with AI Tools programme gives participants practical exposure to reporting, dashboard development and AI-supported analysis that can be applied to real workplace data and business reporting needs.
For more information about our training programmes, visit Excel Academy Malaysia.